Color Chart Freshwater Aquarium Water Testing Chart
If you are a freshwater aquarium enthusiast, you understand the importance of maintaining the right water parameters for the health of your fish and plants. One crucial aspect of this is regularly testing the water to ensure it is safe and balanced. A color chart freshwater aquarium water testing chart is an invaluable tool in this regard. In this article, we will explore the significance of using a color chart for freshwater aquarium water testing and how it can help you achieve optimal water conditions for your aquatic pets.
Why is a color chart freshwater aquarium water testing chart important?
A color chart freshwater aquarium water testing chart is important because it allows you to easily interpret the test results of your water parameters.
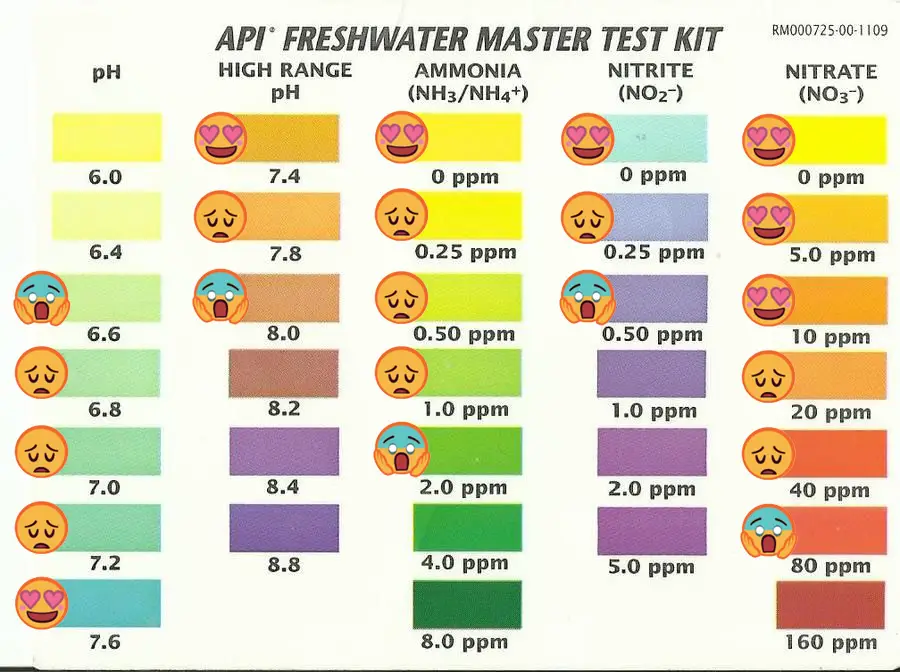
Testing the water in your aquarium is not enough if you cannot accurately interpret the results. This is where a color chart comes in handy. It provides a visual representation of the various water parameters, allowing you to compare your test results with the corresponding colors on the chart. By doing so, you can instantly determine whether your water parameters are within the optimal range or if any adjustments need to be made.
Understanding the color chart
Before we delve into the specifics of the color chart freshwater aquarium water testing chart, let’s understand the key water parameters that are typically tested in freshwater aquariums:
1. pH level: The pH level of your aquarium water determines its acidity or alkalinity. Most freshwater fish thrive in a pH range of 6.5 to 7.5.
2. Ammonia level: Ammonia is toxic to fish and can build up in the aquarium through fish waste and decaying matter. It is crucial to monitor and control ammonia levels to ensure a healthy environment for your fish.
3. Nitrite level: Nitrites are produced as a byproduct of the breakdown of ammonia. High nitrite levels can be harmful to fish, causing respiratory distress and even death.
4. Nitrate level: Nitrates are the final product of the nitrogen cycle in aquariums. While moderate levels of nitrates are generally not harmful to fish, high levels can lead to poor water quality and contribute to algae growth.
Now, let’s take a closer look at how a color chart works for each of the above parameters:
pH color chart
The pH color chart typically consists of a range of colors from yellow to green to blue, representing the various pH levels. It also includes numerical values corresponding to each color. To use the chart, you would compare the color of the test solution with the chart and identify the corresponding pH value. This will help you determine whether your aquarium water is acidic, neutral, or alkaline.
Ammonia color chart
The ammonia color chart shows a range of colors from light green to dark blue, representing different ammonia concentrations. By comparing the color of your test solution with the chart, you can determine the ammonia level in your aquarium. Ideally, ammonia levels should be at zero for a healthy aquarium.
Nitrite color chart
The nitrite color chart follows a similar pattern as the ammonia color chart, with colors ranging from light purple to dark purple. By comparing the color of your test solution with the chart, you can determine the nitrite level in your aquarium. Again, the aim is to maintain nitrite levels at zero for the well-being of your fish.
Nitrate color chart
The nitrate color chart typically consists of shades of yellow and orange, representing different nitrate concentrations. By comparing the color of your test solution with the chart, you can determine the nitrate level in your aquarium. Ideally, nitrate levels should be kept below 20 ppm (parts per million) for freshwater aquariums.
Using the color chart
Now that we understand how a color chart works for freshwater aquarium water testing, let’s discuss the steps involved in using it effectively:
1. Conduct the water test using the appropriate water testing kit for each parameter.
2. After obtaining the test result, compare the color of your test solution with the corresponding colors on the color chart.
3. Identify the color on the chart that closely matches the color of your test solution. This will indicate the level of the respective parameter in your aquarium.
4. Take note of the numerical value or range associated with the identified color. This will give you a precise measurement of the parameter.
5. Based on the test results, take any necessary actions to rectify imbalances or maintain optimal water conditions.
Frequently Asked Questions
1. How often should I test my freshwater aquarium water?
It is recommended to test your freshwater aquarium water at least once a week, especially if you have a new tank or recently introduced new fish or plants. Regular testing helps you identify any issues early on and take corrective actions.
2. Can I use the same color chart for different brands of water testing kits?
Yes, color charts are generally standardized and can be used with different brands of water testing kits. However, it is always a good idea to cross-reference the colors and values with the specific instructions provided by the manufacturer of your water testing kit.
3. Is it necessary to use a color chart or can I rely on numerical values alone?
While numerical values provide precise measurements, a color chart adds ease of interpretation and visual representation. It helps you quickly identify the range of your water parameters and take appropriate actions. Therefore, it is highly recommended to use a color chart alongside numerical values.
4. Can I download a digital version of a color chart for freshwater aquarium water testing?
Yes, many manufacturers provide digital versions of their color charts that can be downloaded from their official websites. These digital charts can be printed and used just like their physical counterparts.
Final Thoughts
A color chart freshwater aquarium water testing chart is an essential tool for every freshwater aquarium hobbyist. It simplifies the process of interpreting water test results and helps you maintain optimal water conditions for your fish and plants. By regularly testing and monitoring your water parameters using a color chart, you can create a thriving and healthy environment for your aquatic pets. So, don’t overlook the importance of this small but mighty tool in your aquarium maintenance routine!


